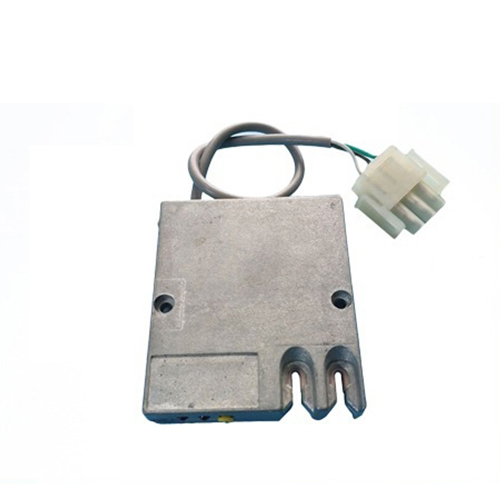
motherboard temperature sensor
- time:2025-08-25 03:32:12
- Click:0
Motherboard Temperature Sensors: Your PC’s Unsung Health Guardians
Your computer suddenly slows to a crawl during an intense game. The fans roar like a jet engine. You feel warm air blasting from the vents. What’s happening? Often, the silent heroes working behind the scenes to prevent disaster – your motherboard’s temperature sensors – are kicking into high gear. Understanding what they are, how they function, and why they matter is crucial for maintaining a healthy, high-performing PC.
More Than Just a Number: The Vital Role of Thermal Monitoring
At its core, a motherboard temperature sensor is a tiny electronic component strategically placed on the printed circuit board (PCB). Its singular job is straightforward: measure the heat level at its specific location and report that data. But the implications for your entire system are profound. Modern processors (CPUs), graphics cards (GPUs), chipsets, and even power delivery circuits (VRMs) generate significant heat during operation. Without effective thermal management, this heat can:
- Cause Instability: Excess heat can lead to system crashes, freezes, or unexpected reboots as electronic components malfunction.
- Trigger Throttling: To prevent physical damage, CPUs and GPUs will automatically reduce their operating speed (thermal throttling) when temperatures exceed safe thresholds. This directly impacts performance, leading to frustrating slowdowns.
- Reduce Lifespan: Consistently high temperatures accelerate the degradation of electronic components, shortening the overall lifespan of your motherboard, CPU, and other hardware.
- Risk Permanent Damage: In extreme cases with failed cooling, components can literally overheat and burn out.
This is where temperature sensors become indispensable. They are the early warning system, constantly feeding temperature data to the motherboard’s firmware (BIOS/UEFI) and operating system.

Anatomy of Monitoring: Where Sensors Lurk and What They Measure
Motherboards feature multiple temperature sensors, each assigned to monitor a critical area:
- CPU Socket Area: Sensors near the CPU socket primarily track the temperature of the Voltage Regulator Module (VRM), responsible for delivering clean, stable power to the processor. While they don’t measure the CPU die temperature directly (that’s the CPU’s internal sensor’s job), they are vital for VRM health, especially during overclocking or high-load scenarios. Overheating VRMs can throttle the CPU’s power supply or cause system instability.
- Chipset: The motherboard chipset (like Intel’s Z-series or AMD’s B-series chipsets) acts as the central traffic controller. It has its own temperature sensor. While chipsets generally run cooler than CPUs/GPUs, prolonged high loads (like multiple high-speed NVMe drives) can cause elevated temperatures.
- System/Ambient: Often labeled “System Temperature” or “Motherboard Temperature” in monitoring software, this sensor typically measures the general air temperature within the case near the motherboard surface. It’s a good indicator of overall case airflow effectiveness.
- M.2 SSD Slots (Increasingly Common): High-performance NVMe SSDs generate noticeable heat. Many modern motherboards include dedicated sensors near M.2 slots to monitor SSD temperatures and potentially warn of thermal throttling affecting drive speeds.
- Other Areas: Higher-end boards might feature sensors monitoring specific power phases, the PCIe slot area, or even dedicated headers for external sensors you can attach to other components.
Reading the Signs: Accessing Temperature Data
You might be wondering, “My computer doesn’t display temperatures on the desktop by default. So how do I see this data?” Thankfully, accessing motherboard temperature readings is straightforward:
- BIOS/UEFI Setup: Enter your system’s BIOS/UEFI interface (usually by pressing DEL, F2, or F12 during boot). Most firmware interfaces have a dedicated “Hardware Monitor,” “PC Health,” or “Status” section displaying core temperatures, including motherboard sensors and CPU readings. This is useful for a quick check before the OS loads.
- Operating System Software: This is the most convenient method. Numerous free and paid applications can read the sensors:
- HWMonitor (Free/Classic): Extremely popular, lightweight, and provides a comprehensive overview of voltages, temperatures (CPU, GPU, motherboard sensors), and fan speeds.
- HWiNFO (Free): Offers incredibly deep system information, including detailed sensor readouts from all detected sources.
- Open Hardware Monitor (Free/Open Source): Similar to HWMonitor, providing clear temperature and fan speed displays.
- Motherboard Manufacturer Utilities: Companies like ASUS (AI Suite), Gigabyte (SIV/System Information Viewer), MSI (Command Center/Dragon Center), and ASRock (A-Tuning) provide their own software suites that include temperature monitoring, often with fan control features.
Look for labels like “Motherboard,” “System,” “TMPIN#” (where # is a number), “Chipset,” “PCH,” “VRM,” or specific zone names provided by the motherboard maker.
Interpreting the Readings: What’s Hot and What’s Not?
Seeing a number is one thing; knowing if it’s a problem is another. Understanding motherboard temperatures requires context:
- “Safe” Ranges Vary: Unlike CPUs which typically have a known max TJunction (e.g., ~100°C for many modern Intel/AMD chips), motherboard components don’t have universally agreed-upon “max safe” temperatures published. Generally:
- System/Motherboard Temp: Under normal load, staying below 50-55°C is excellent. 55-70°C might be warm but often acceptable depending on airflow. Consistently above 70-75°C warrants investigation into case cooling. Idle temps are usually near the ambient room temperature.
- VRM Temperatures: These are more critical under heavy CPU load (gaming, rendering, CPU stress tests). Below 75-80°C is generally fine. 80-95°C is getting warm to hot and could indicate borderline cooling, potentially impacting stability under sustained heavy loads. Sustained operation above 100-105°C is risky and can shorten component lifespan or cause throttling/shutdowns.
- Chipset Temp: Usually runs cooler. Below 70°C is typical. Consistently above 75-80°C might suggest poor airflow over the chipset heatsink.
- M.2 SSD Temp: Refer to your specific SSD specs, but generally, below 70°C under load is good. SSDs will throttle performance around 75-85°C to protect themselves.
- Load vs. Idle: Always compare temperatures at idle (system booted, minimal programs running) and under load (gaming, stress test, heavy rendering). Large spikes under load are normal, but sustained high temperatures are the concern. Use a stress test tool (like Prime95 for CPU, FurMark for GPU) to generate maximum heat for testing.
- Ambient Temperature: The temperature of the room your PC is in directly affects all internal temps. A hot room means hotter components. Consider this when comparing readings.
- Case Airflow is Paramount: High motherboard temperature readings, especially System and VRM, are often a symptom of poor internal case airflow. Dust buildup, blocked vents, or insufficient intake/exhaust fans are common culprits.
Troubleshooting High Motherboard Temperatures
If your temperature sensor readings are consistently high, especially for VRMs or System:
- Check Case Airflow:
- Dust Removal: Power down, open the case, and carefully remove dust buildup from fans, heatsinks (CPU, chipset, VRM if visible), and air vents using compressed air. This is the most common fix.
- Fan Configuration: Ensure you have adequate intake fans (usually front/bottom) pulling


